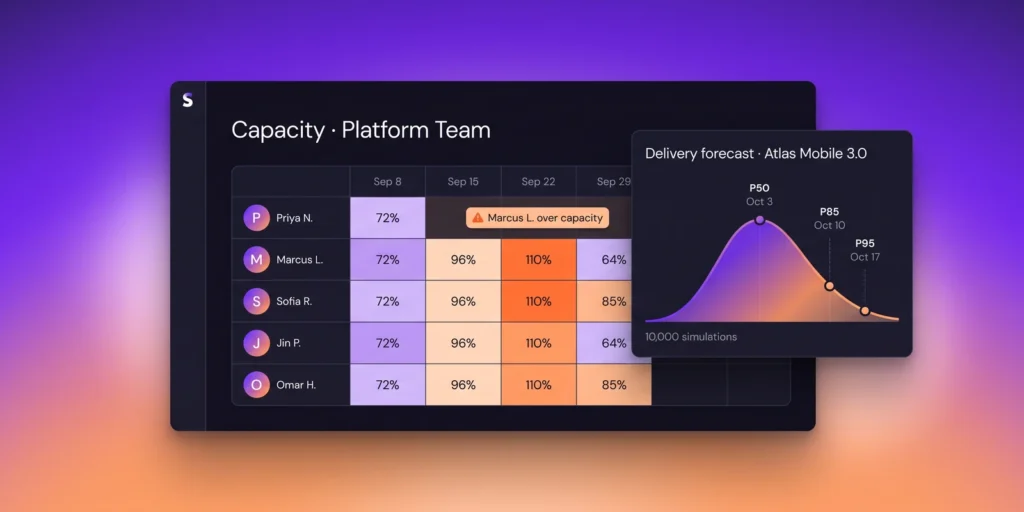
Plan Around Real Capacity, Not Optimistic Dates
- Engineering managers: see who is over-allocated next week before sprint planning starts.
- PMO and delivery leads: publish forecast ranges instead of single dates that invite surprises.
- Executives: compare hiring, scope and priority scenarios using one shared forecast model.
- Team members: fewer overbooked weeks, because PTO and real working hours are part of the plan.
How Forecasts Are Calculated
- Collect: roles, skills, weekly hours and PTO calendars define available capacity.
- Aggregate: assigned and planned work is mapped to people and weeks to build the workload heatmap.
- Simulate: 10,000 Monte Carlo runs sample trailing 120-day cycle times while respecting capacity and dependencies.
- Report: P50, P85 and P95 dates are published to the project and recalculated as work changes.
- Compare: scenarios rerun the same simulation with changed headcount, scope or priorities.
Key Capabilities
- Skills matrix and role-based capacity, set in hours per week for each person.
- PTO and holiday sync from Google and Microsoft calendars.
- Workload heatmap by person, team and week, with drill-down to the assigned tasks.
- Over-allocation alerts delivered to managers before a week is overbooked.
- Monte Carlo delivery forecasts over historical cycle-time distributions: 10,000 runs, P50/P85/P95 dates.
- Scenario planning: add headcount, move scope or change priorities, then compare forecasts side by side.
- Capacity shared with AI Task Orchestration, so sprint auto-planning avoids overloading anyone.
Integrations, API & Limits
| Item | Detail |
|---|
| Calendar sync | Google and Microsoft calendars (PTO and holidays) |
| Work sources | Synapse projects, GitHub, Jira |
| Forecast endpoint | POST /v1/forecasts (asynchronous) |
| Workload endpoint | GET /v1/capacity/workload |
| Webhook | forecast.completed (HMAC-SHA256 signed, automatic retries) |
| Simulation | 10,000 runs per forecast; P50, P85 and P95 dates |
| API rate limit | Business 1,000 · Enterprise 3,000 req/min (burst 2×) |
Responsible Use & Data Handling
- Not for automated employment decisions; see the AI & Responsible Use Policy.
- Heatmap and forecast visibility follows workspace roles and space permissions.
- Calendar sync limited to availability, PTO and holidays.
- Audit log entries for capacity, skills and scenario changes.
- Encryption in transit (TLS 1.2+) and at rest (AES-256).
- Individual data limited to what planning needs: roles, skills, working hours and time off.
Availability & Pricing
| Plan | Included | Price (flat per workspace, EUR) |
|---|
| Starter | No | €10 / 1 month · €25 / 3 months · €45 / 6 months · €70 / 12 months (best value) |
| Team | No | €13 / 1 month · €35 / 3 months · €60 / 6 months · €100 / 12 months (best value) |
| Business | Yes | €15 / 1 month · €40 / 3 months · €70 / 6 months · €120 / 12 months (best value) |
| Enterprise | Yes | €20 / 1 month · €50 / 3 months · €85 / 6 months · €150 / 12 months (best value) |
Commit to Dates Your Team Can Actually Hit